FACETAS
Las facetas tienen por objeto segmentar gráficos, en función de una variable categórica.
library(reticulate)
library(gcookbook)
library(ggplot2)
library(dplyr)
Crear el gráfico base
CO2_plot <- ggplot(CO2, aes(x = conc, y = uptake)) +
  geom_point()
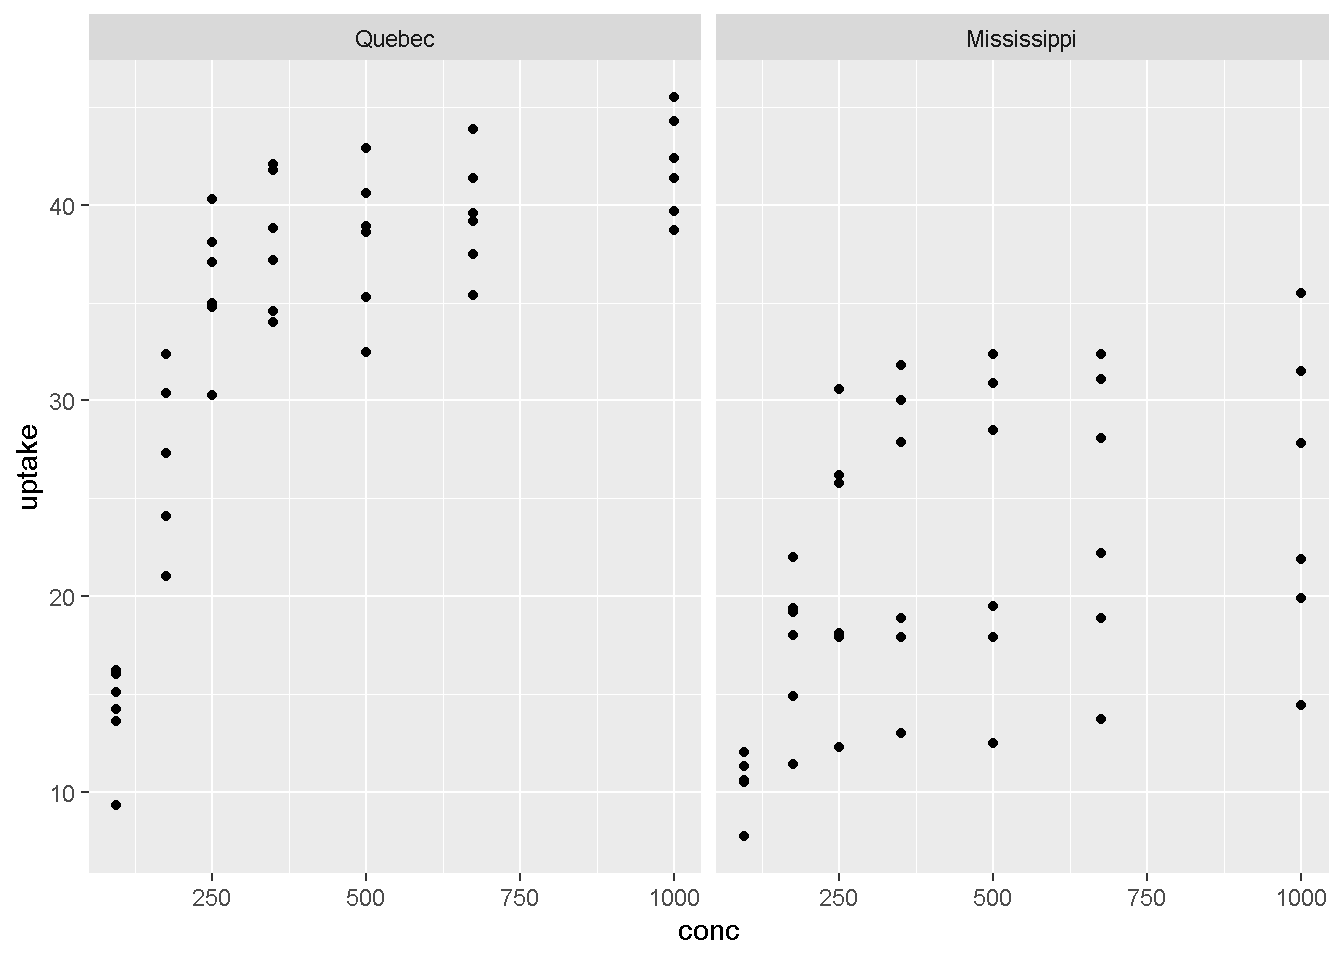
Crear facetas horizontales
CO2_plot +
  facet_grid(. ~ Type)
Crear facetas verticales
CO2_plot +
 facet_grid(Treatment ~ .)

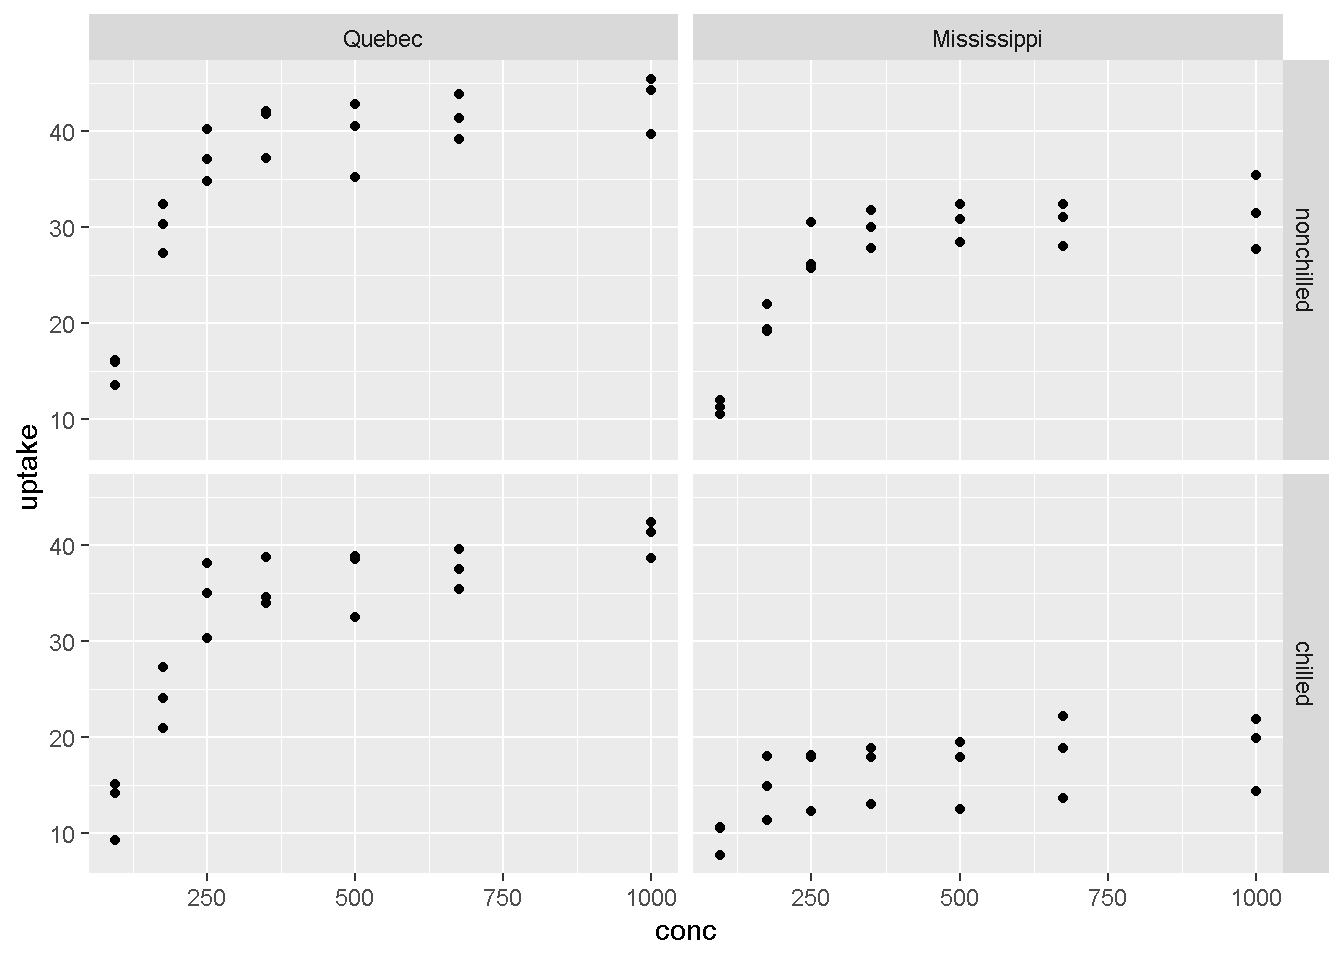
Crear facetas con doble entrada
CO2_plot +
 facet_grid(Treatment ~ Type)